Insights: Hourly product revenue
Last updated: September 22, 2026
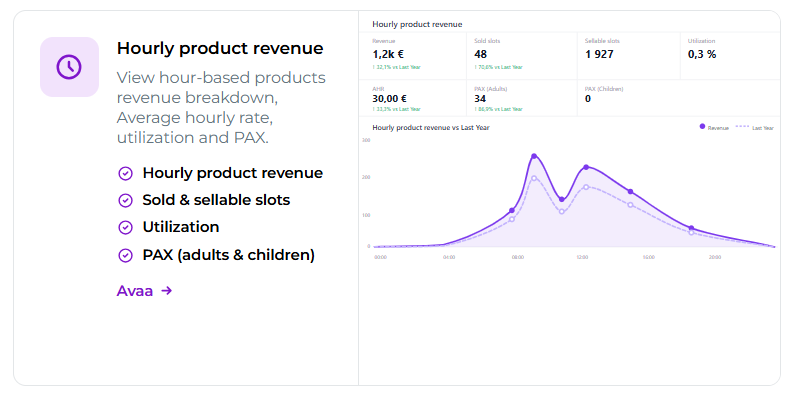
Hourly product revenue brings together the key metrics for your hourly products in one view. It allows you to track, for example, product sales, utilization, customer numbers, and average hourly revenue, and compare performance with the previous year.
The view is particularly suitable for monitoring the performance of activities, equipment rentals, and other hourly products.
You can find the view under Analytics > Insights > Hourly product revenue.
The Hourly product revenue view is available from the Small+ package and above.
What does Hourly product revenue tell you?
At the top of the view, you will find the key metrics for the selected period.
Sellable Slots – Available times
Shows how much sellable capacity the product has had. The calculation is based on the minutes during which the product was open and available for booking, less the times closed for sales.
Capacity is converted into slots corresponding to the product’s original duration. This also makes it possible to include virtual products of different durations in the same figure.
Sold Slots – Sold times
Shows how much of the available capacity has been booked. Sold Slots are also converted into slots corresponding to the product’s original duration, so they can be compared directly with the Sellable Slots figure.
For example, if the original product duration is 120 minutes but the virtual product created from it has a duration of 180 minutes, a 180-minute booking corresponds to 1.5 slots of the original product. This is why slot figures are not always whole numbers.
Main Product Revenue – Revenue from the main product
Revenue generated from sales of the actual hourly product. The figure does not include revenue from additional services included in or purchased separately for the booking.
Avg. Hourly Revenue – Average hourly revenue
Shows how much the main product has generated on average per booked hour.
Utilization % – Utilization rate
Shows what proportion of the product’s bookable time has been in use.
Total PAX – Number of customers
The total number of people in bookings.
PAX Adults – Adults
The total number of adults in bookings.
PAX Children – Children
The total number of children in bookings.
Compare revenue with the previous year
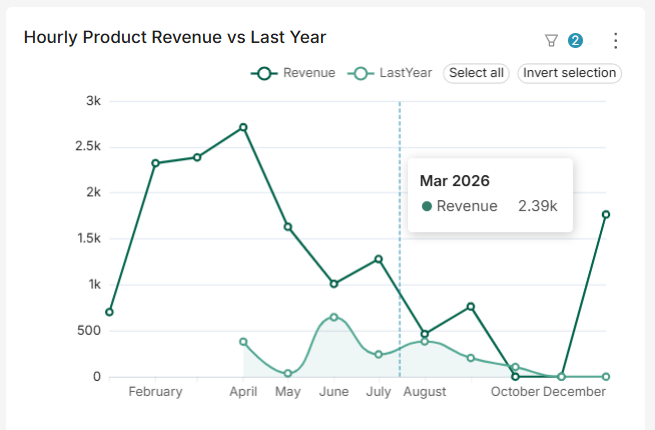
Hourly Product Revenue vs Last Year chart shows the development of hourly product revenue compared with the corresponding period of the previous year.
The revenue shown in the chart includes revenue from the main product and extra services included in the booking. Revenue from extra services purchased separately is not included in this chart.
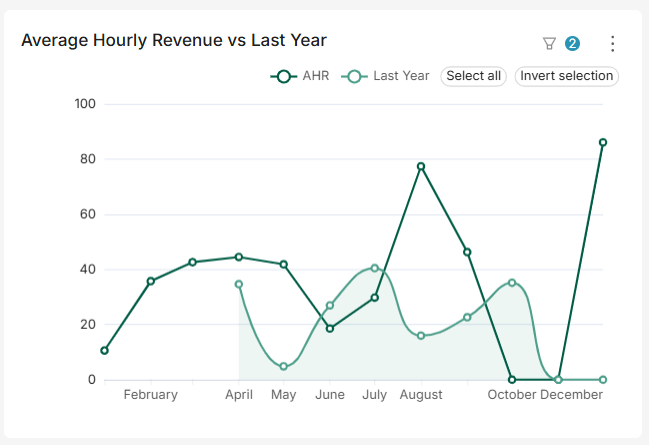
Average Hourly Revenue vs Last Year helps you track how average revenue per booked hour has developed.
By examining these together, you can see, for example, whether sales growth is due to a higher number of bookings or to each booked hour generating more revenue than before.
Track changes in customer numbers
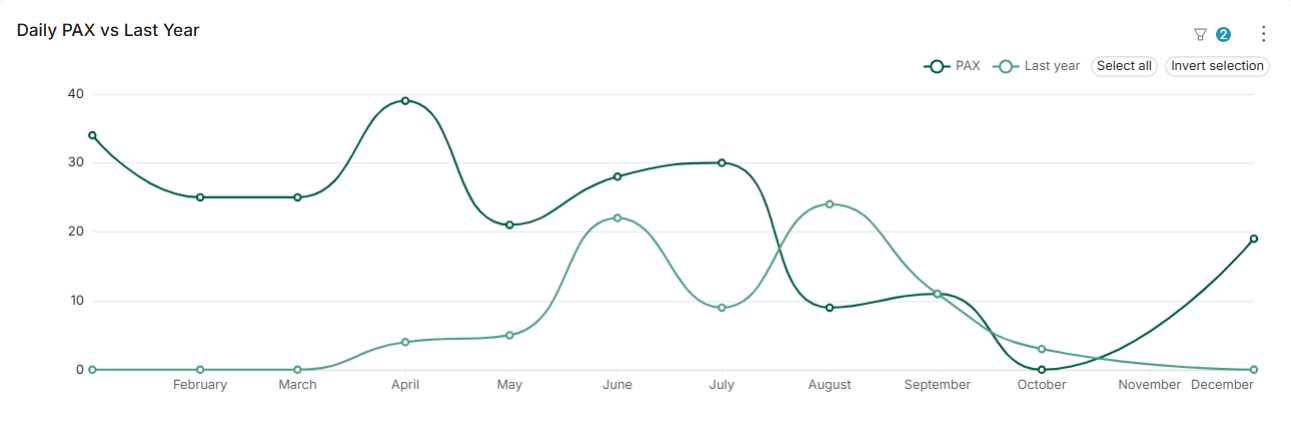
Daily PAX vs Last Year shows the development of the number of people in bookings and compares it with the corresponding period of the previous year.
You can use it, for example, to track seasonal trends and identify periods when customer numbers differ from the previous year.
Track capacity utilization
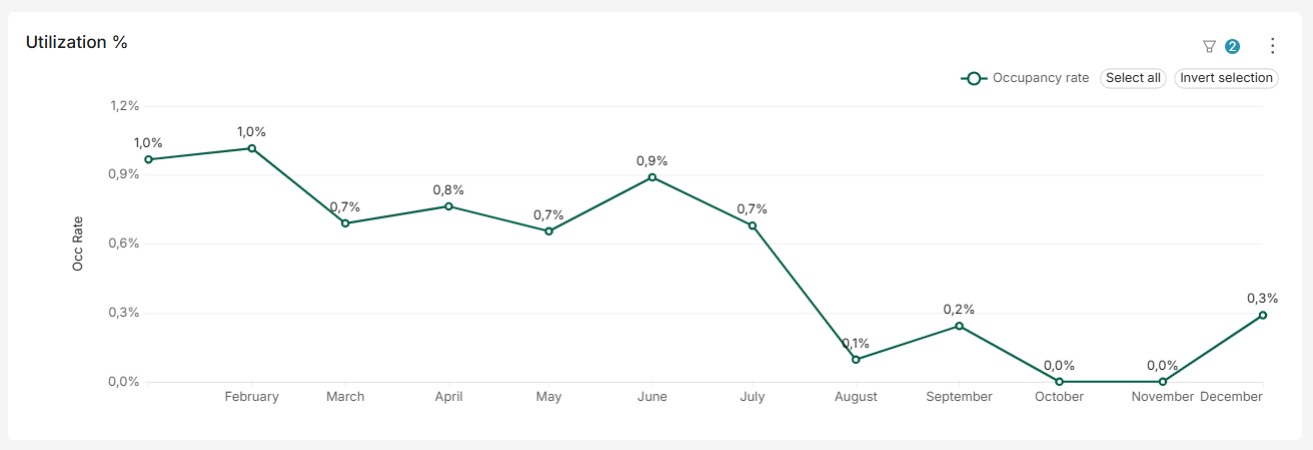
Utilization % helps you understand how efficiently the bookable capacity of your products is being used.
Sales volume alone does not always tell the whole story: the same sales can indicate very different performance depending on how much capacity was available. Utilization rate allows you to examine sales in relation to actual availability.
See what your revenue consists of
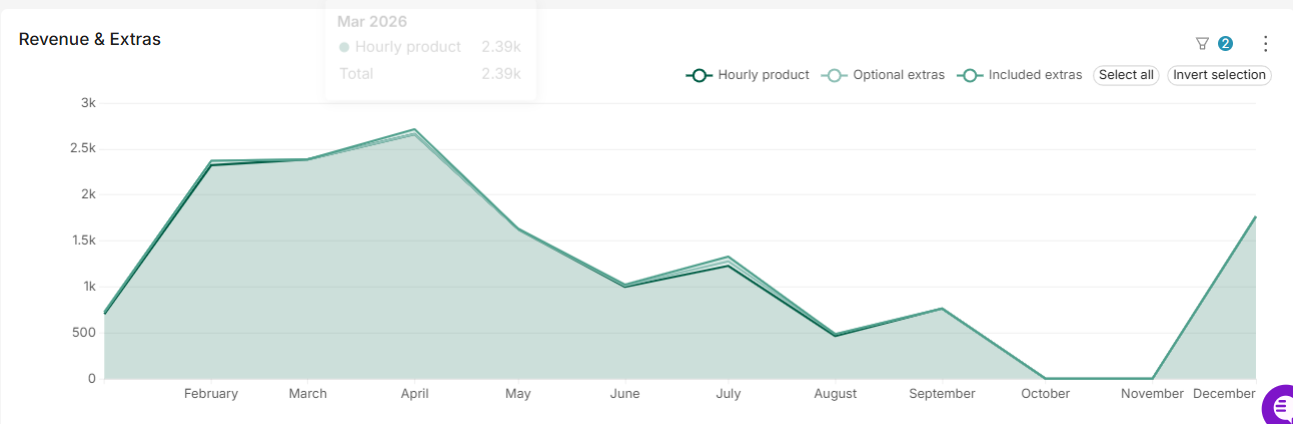
Revenue & Extras chart shows separately:
revenue from the hourly main product
revenue from extra services included in the booking
revenue from separately purchased extra services
This allows you to examine not only the sales of the main product but also how much extra services increase total sales.
Filters – the dashboard’s most powerful tool
The filters on the left side of the dashboard control the entire view. The filters can be opened using the arrow button on the left.
Important: All filters affect the entire dashboard simultaneously. When you make a change, it is updated across all views at once.
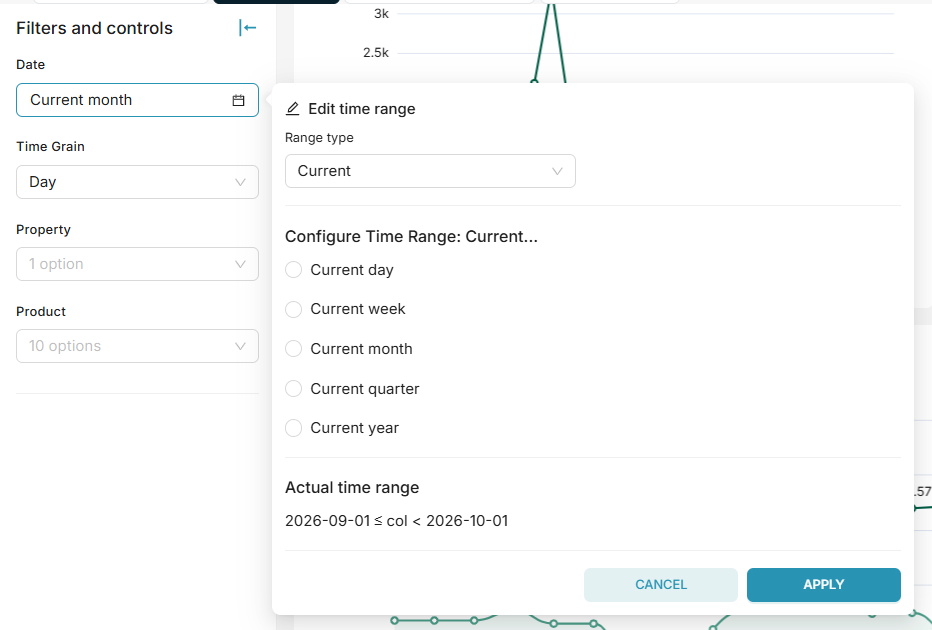
Available filters
Date range (Date)
Time granularity (Time grain)
Products (Product)
Property (Property)
Pro tip! Start without filters and narrow the view down step by step afterward. This way, you first get an overall picture and then deepen your analysis.
Export data to Excel
You can download the data behind the charts to Excel for further processing. Exporting is useful, for example, for creating your own calculations and reports, analyzing data in more detail, or combining it with other information.
Summary
Track the sales and capacity utilization of hourly products.
Compare revenue and customer numbers with the previous year.
Review average hourly revenue and utilization rate.
Analyze how sales from the main product and extra services are formed.
Filter data by date range, property, and products.
Export data to Excel for more detailed analysis.