Insights: Room revenue
Last updated: September 22, 2026
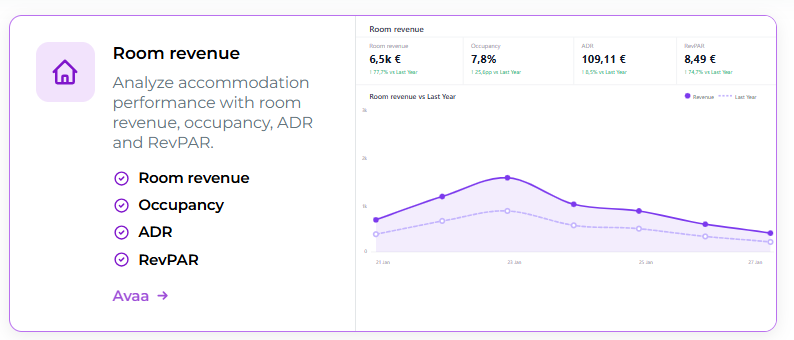
Room revenue brings together the key figures for your accommodation business in one view. It allows you to quickly see how your room sales are developing, how efficiently your capacity is being used, and how this year's results compare with the previous year.
You can find the view under Analytics > Insights > Room revenue.
The Room revenue view is available from the Small+ package and above.
What does Room revenue tell you?
At the top of the view, you will find the key figures for the selected period. Alongside the figures, you can also see the change compared with the corresponding period of the previous year, making it easy to spot the trend at a glance.
Total rooms
The total number of rooms belonging to the selected category.
Sellable room nights
The total number of room nights that were available for sale during the selected period. Out-of-use reservations are deducted from the rooms available for sale.
Sold rooms
The number of room nights sold. Complimentary, or €0 reservations, are not included in this figure. Out-of-order reservations are also not counted as rooms sold.
Occ % – Occupancy percentage
Shows what proportion of the rooms available for sale have been booked.
Complimentary €0 reservations are also included in the occupancy rate.
ADR – Average Daily Rate
Shows the average room rate per room sold. The calculation includes room revenue and additional services included in the reservation.
RevPAR – Revenue per available room
Combines the average room rate and occupancy rate into a single key figure. RevPAR helps you understand how efficiently the available room capacity generates revenue.
TRevPAR – Total revenue per available room
Expands the RevPAR analysis by also taking extra services sales into account. This includes both extra services included in the reservation and those purchased separately.
Room revenue
The actual room revenue generated from accommodation. The figure does not include revenue from additional services included in the reservation or purchased separately.
Note! Paid but cancelled bookings are not included in the figures in the Room revenue view.
Track development compared with the previous year
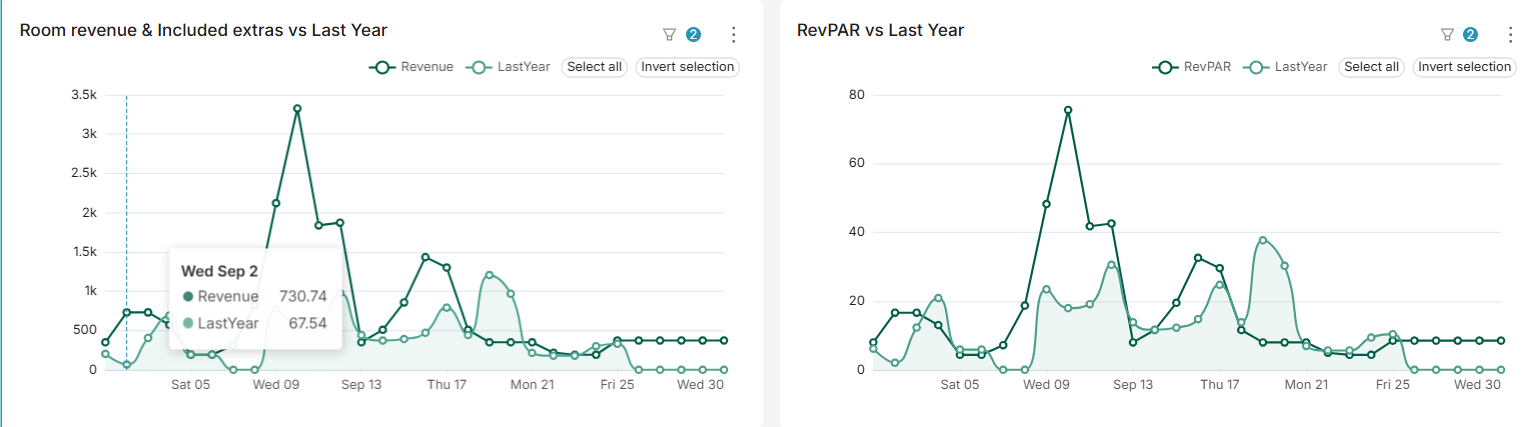
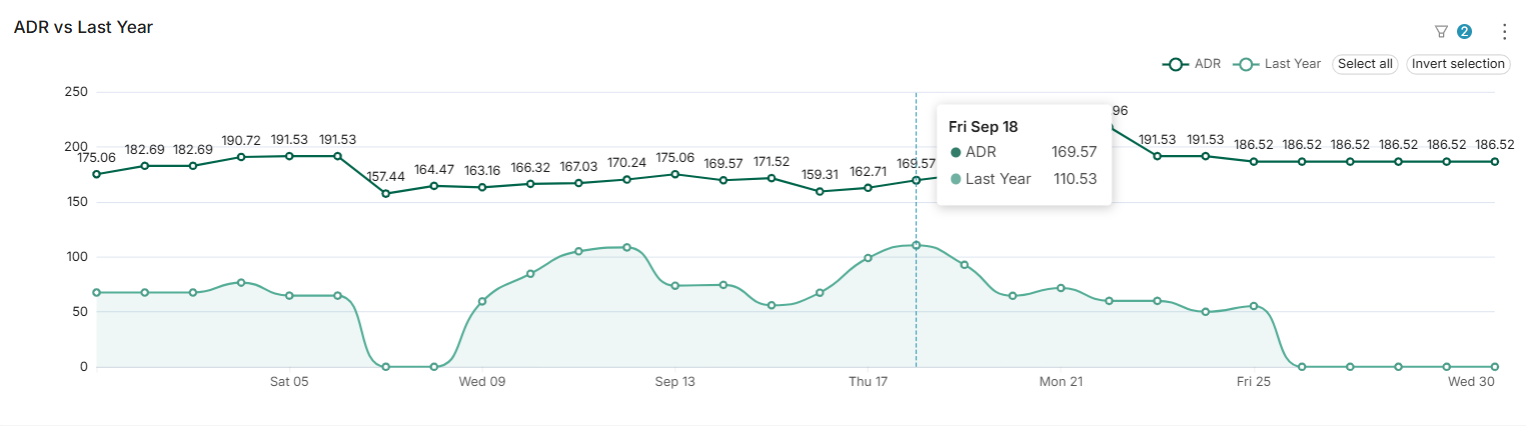
Room revenue does not only show the figures for the current moment. In the view's charts, you can compare, for example, room revenue, RevPAR, ADR, and occupancy rate with the corresponding period of the previous year.
This allows you to quickly see, for example, whether increased room revenue is due to higher occupancy, a better average rate, or both. Similarly, you can identify periods when it would be possible to use your capacity more effectively.
See what your revenue consists of
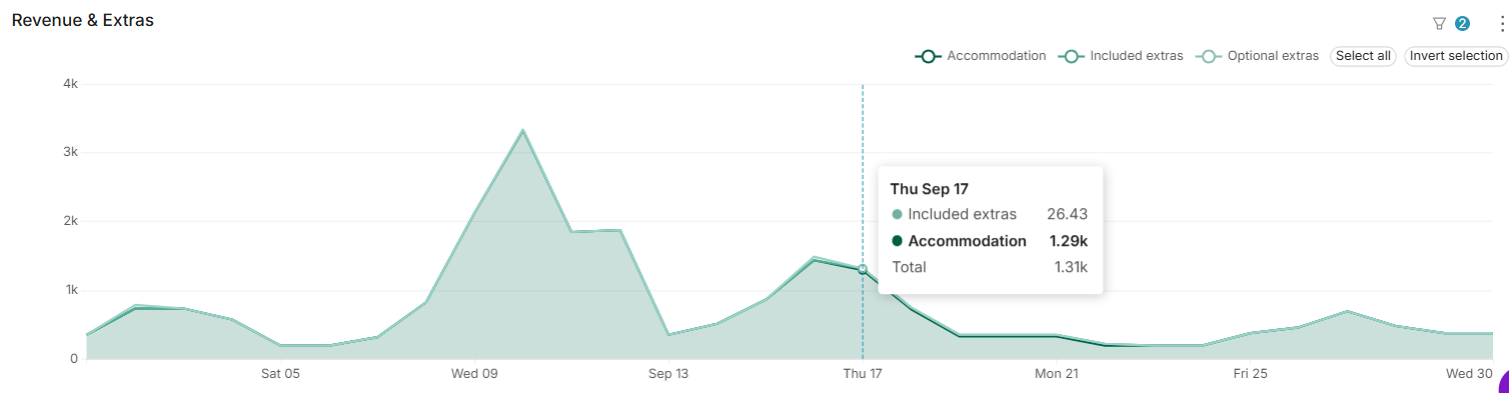
Revenue & Extras chart shows, in addition to accommodation revenue, the revenue from extra services included in reservations and purchased separately.
You can view different revenue types together or separately and track their development by day. This gives you a better understanding of how much of your total sales comes from accommodation itself and how much extra services contribute on top of that.
Use the Room revenue view for decision-making
Room revenue helps you look at room sales as a whole instead of focusing on individual reservations. For example, you can track whether you are selling more or at a higher price, identify quieter periods, and assess developments in pricing and occupancy.
When occupancy, ADR, RevPAR, and revenue are shown in the same view, you can more quickly see what is happening in your business and what is causing the change.
Filters – the dashboard's most powerful tool
The filters on the left side of the dashboard control the entire view. The filters can be opened using the arrow button on the left side.
Important: All filters affect the entire dashboard simultaneously. When you make a change, it is updated across all views at once.
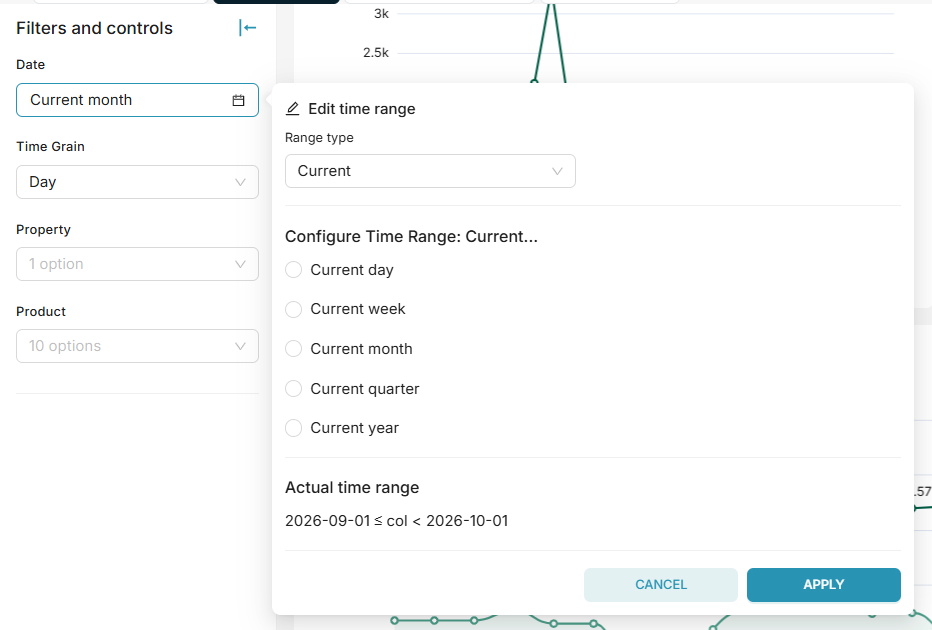
Available filters
Date range (Date)
Purpose:
Track development over time
Compare different periods
Time grain (Time grain)
day / week / month / year
Purpose:
Daily level = operational management
Monthly level = trends and strategy
Products (Product)
Filter by an individual product
Property (Property)
Filter by your properties
Moder Tip! Start without filters first and narrow the view down step by step afterward. This way, you first get an overall picture and only then deepen your analysis.
Export and deepen your analysis
Each section of the dashboard can be exported separately to Excel.
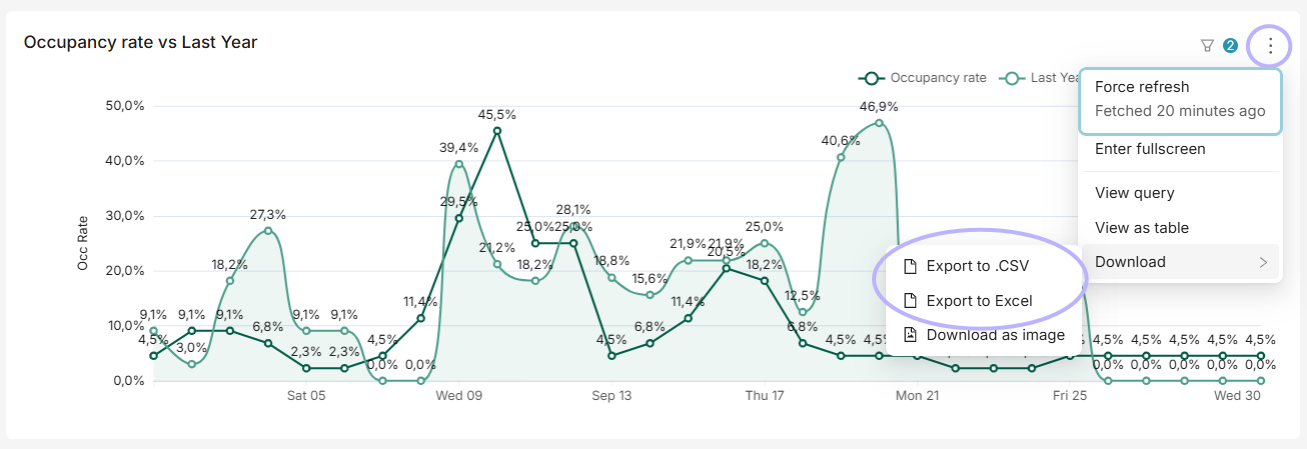
Exporting is useful, for example, when you want to:
create your own calculations, tables, or charts
combine Room revenue data with your other data
examine the figures in more detail than in the dashboard
use the data in your own reporting or share it with others
Summary
Track the key figures for your accommodation business in one view.
Compare the results with the previous year and identify trends.
Narrow down your analysis by date range, property, and products.
Analyze occupancy, pricing, and revenue generation.
Export the data to Excel, when you want to process or report on it in more detail.