Insights: Introduction & Commercial Overview
Last updated: September 8, 2026
Introduction
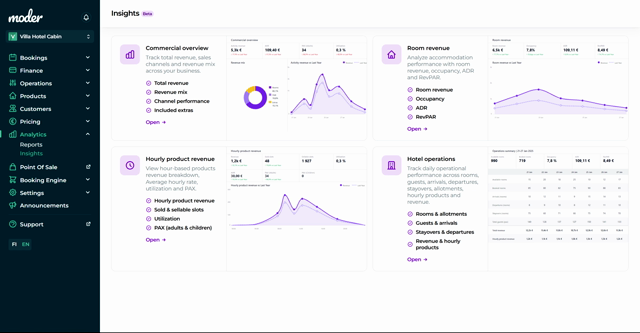
Moder Insights section gives you a clear view:
how your business is performing today
what the year‑end sales look like
what your revenue consists of
👉 You move from static reporting to making real analysis.
Important: Insights does not only show history, but also the forecasts, which helps anticipate the future rather than just analyzing the past.
What questions can insights solve?
Insights is not just a report, but with it you can answer concrete business questions:
How much revenue has a single B2B customer generated this year?
What products and packages does that customer purchase?
Which sales channels generate the most revenue?
How does a single category evolve over time?
Which products are leading in the selected segment?
👉 With these questions, you will get straight to decision-making.
ℹ Note! The insights section is currently available only in English.
Where can I find insights?
A new Analytics-section, under which you can find Reports and Insights.
👉 By clicking you will go directly to the insights main menu.
Every Moder customer has the Commercial Overview -dashboard. If you have Small+ or larger package, you also get Room Revenue, Hourly Product Revenue, and Hotel Operations -dashboards.
Commercial Overview
Let's take a look at the Commercial Overview -dashboard.
1. Revenue forecast vs last year
One of the most important views of the dashboard.
This report shows:
the current year's forecast
compared to the same time last year
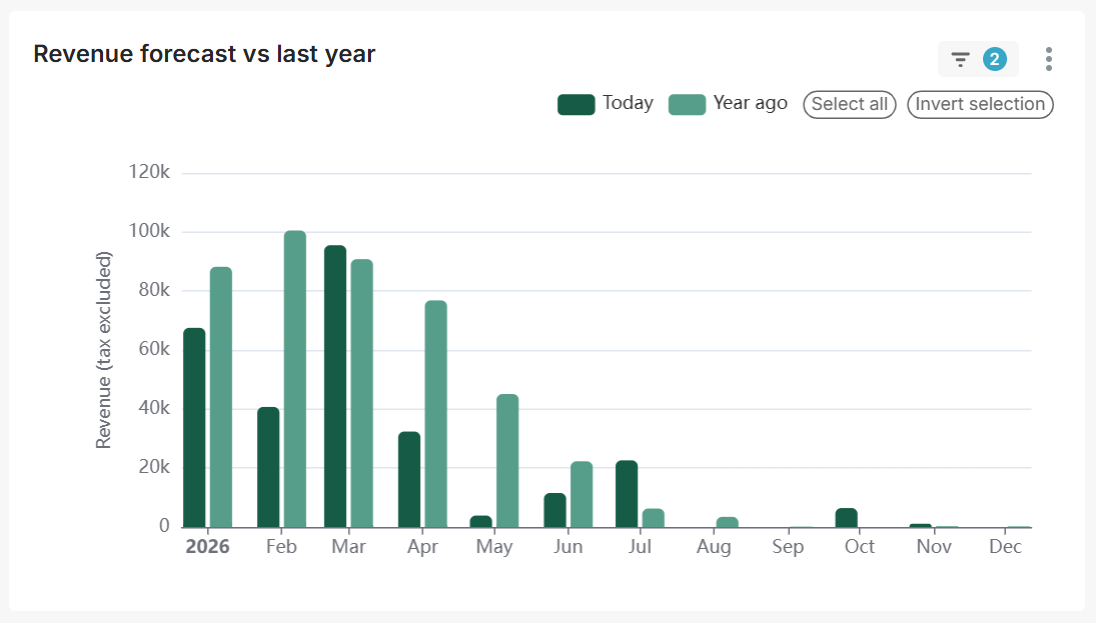
Example:
The selected day is 8.4.2026, the report compares the sales situation to the same time a year earlier, i.e. 8.4.2025.
What should be concluded from this:
Are you ahead or behind in the revenue forecast?
Is the growth in line with the targets?
Actions based on the report:
If you are behind → increase sales, campaigns, or visibility for that time period
If you are ahead → review pricing and capacity utilization
2. Revenue by channel
This report shows where revenue comes from. For example:
own online store
backoffice reservations
POS
Booking.com, Airbnb, Viator, GetYourGuide and other external channels
With Commercial overview, you can also view individual reservations made through the online store.
This report tells you, among other things, which channels generate the most revenue or whether you may be too dependent on a single channel.
Based on this report you can assess which channels to invest in and whether the risk should possibly be diversified more.
Moder Tip! By clicking, for example, the Webshop slice, the entire dashboard is filtered according to that sales segment.
3. Revenue forecast by category / product
These two views belong together and correspond to two key questions:
Category → What does your business consist of?
Product → Which individual products generate revenue?
Together they tell: where the money comes from and what concretely makes it.
How are views read together?
Step 1: Start from the category level
Examine how revenue is distributed:
accommodation
activities
food
additional services
This gives you an overall view of your business structure.
Step 2: Move to the product level
When you identify the most important category, drill down to it at the product level:
which products generate revenue?
is there a single clear winning product?
Practical analysis model
Go through these in order:
Which category is the biggest? → where the money is
Which products drive it? → what actually sells
Is there concentration risk? → too much dependency on a single product or category?
Where is the growth potential? → small but growing category or product
Moder Tip! Don’t just look at the largest category. Also look at which one is growing the fastest and where there is the most development potential. 👉 The biggest isn’t always the most important. The fastest-growing is often the most interesting.
4. Best products, packages and corporate customers
(Top Products, Top Packages & Top B2B Customers)
These three views show what are the real drivers of your business:
Top Products → which individual products sell best
Top Packages → which bundles generate the most
Top B2B Customers → which customers bring revenue
Together these views answer the question: what sells, how it is sold and to whom.
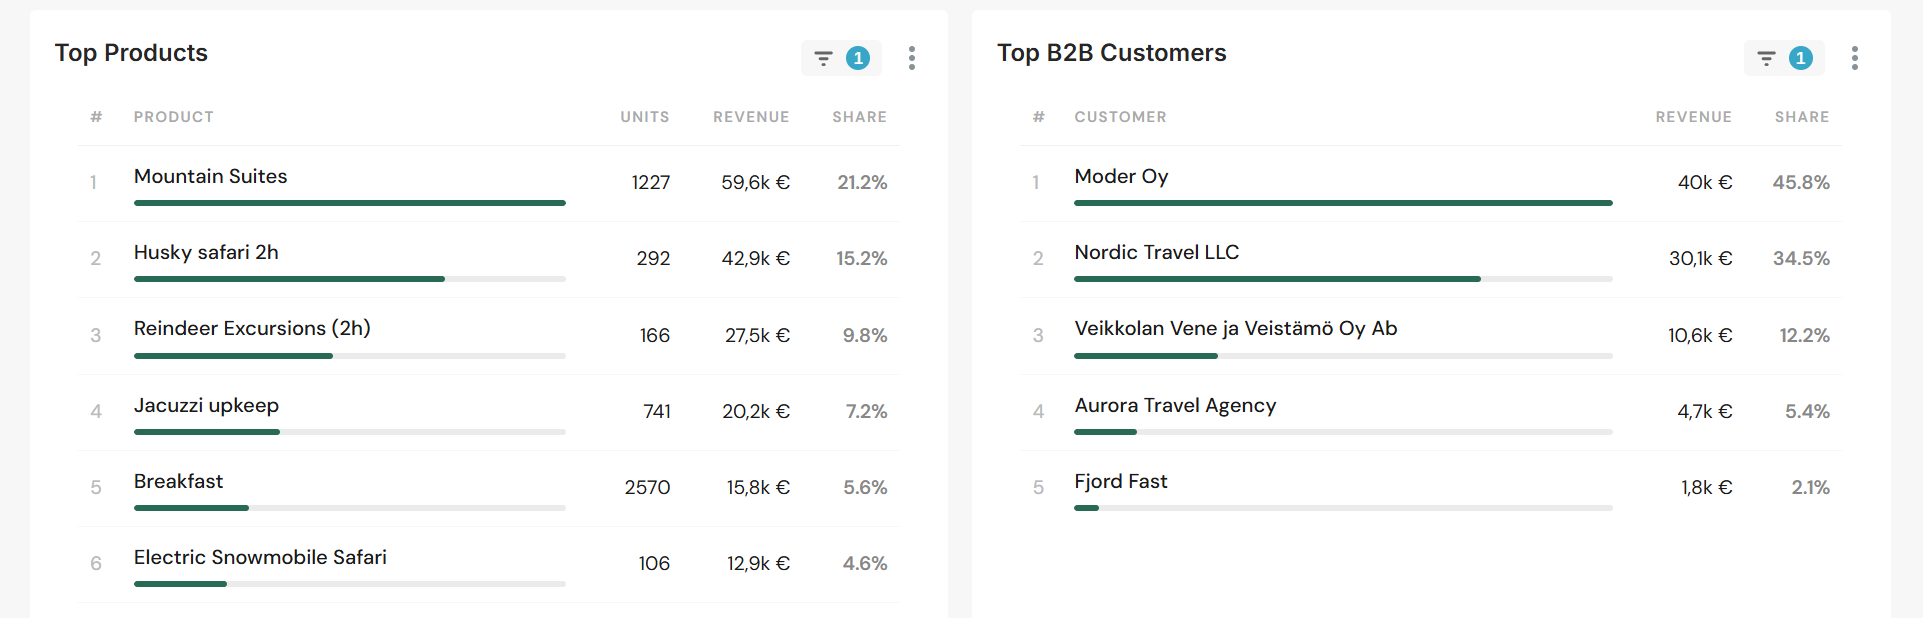
What information can be seen from the charts?
Top Products
Information displayed:
Units (quantity)
Revenue (turnover)
Share (share of total sales)
This is the only view where you see both: sales quantity (volume) and monetary value.
Thus you can distinguish:
Volume products → lots of sales, lower value
Value products → fewer sales, high value
Combinations → high volume + high value
Top Packages and Top B2B customers
Data to display:
Revenue (turnover)
Share (share of sales)
In these views the focus is on value and share, not on unit counts.
8. Sales breakdown (Sales VAT breakdown and Sales by category and product)
What do these show?
Sales VAT Breakdown → sales breakdown by VAT rates
Sales by Category and Product → detailed breakdown of sales by category and product
Sales VAT Breakdown
This table shows:
Revenue by VAT rate
VAT's share
Total sums
The table supports financial management and reporting. With it you can also quickly see how sales are distributed across different tax rates.
Sales by Category and Product
This table, in turn, shows:
Sales volumes
Revenue
Breakdown by categories and products
This table provides the deepest view of sales on the dashboard, and with it you can see exactly where the revenue comes from.
Filters – the dashboard's most powerful tool
The filters on the left side of the dashboard control the whole view. The filters open to visibility from the left side arrow button.
‼Important: All filters affect the entire dashboard simultaneously. When you make a change, it updates all views at once.
Available filters:
Time interval (Date)
Purpose:
Track development over time
Compare different periods
Time level (Time grain)
day / week / month / year
Purpose:
Day level = operational management
Month level = trends and strategy
Categories (Category)
Filter by product groups (e.g., accommodation, activity, add-ons)
Purpose: which part of the business generates the most
Packages (Package)
Filter by package products
Purpose: Analyze the significance of packages in sales
Products (Product)
Filter by individual product
Corporate customers (Company)
Filter corporate customers
Purpose: B2B sales analysis and key customer identification
Sales channels (Sales Channel)
Filter by sales channel
Purpose: e.g., Where does the sales come from? Which channel should be expanded?
Moderator Tip! Start first without filters and narrow the view step by step only after that. This way you first get an overview and only then deepen the analysis.
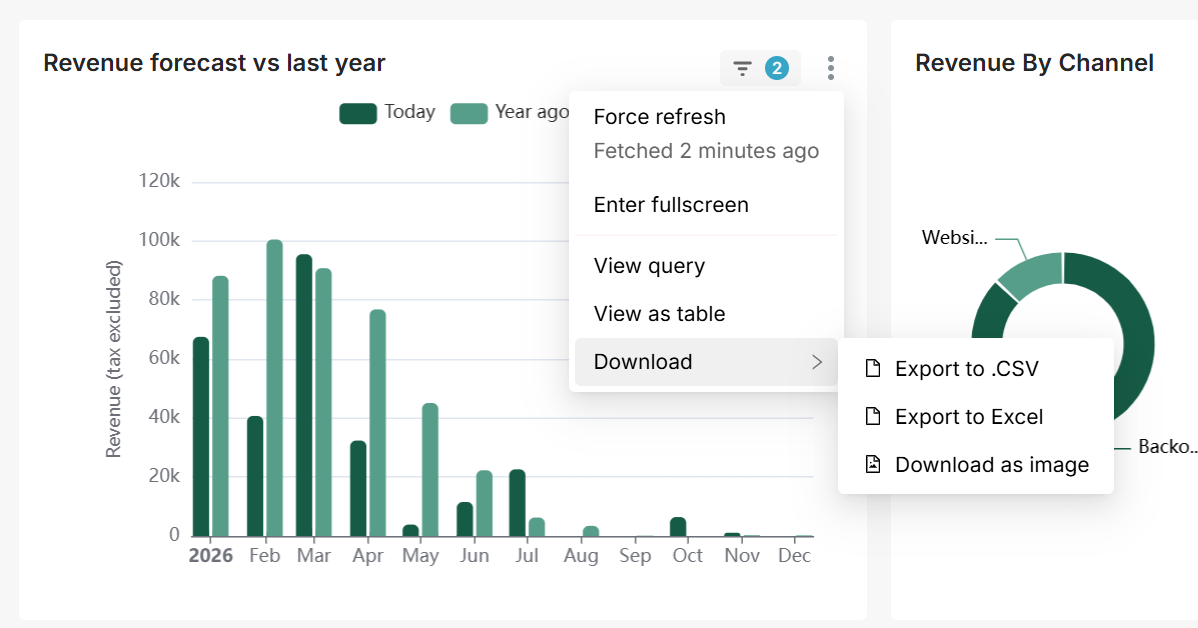
Export and deepening analysis
Each dashboard section can be exported separately to Excel.
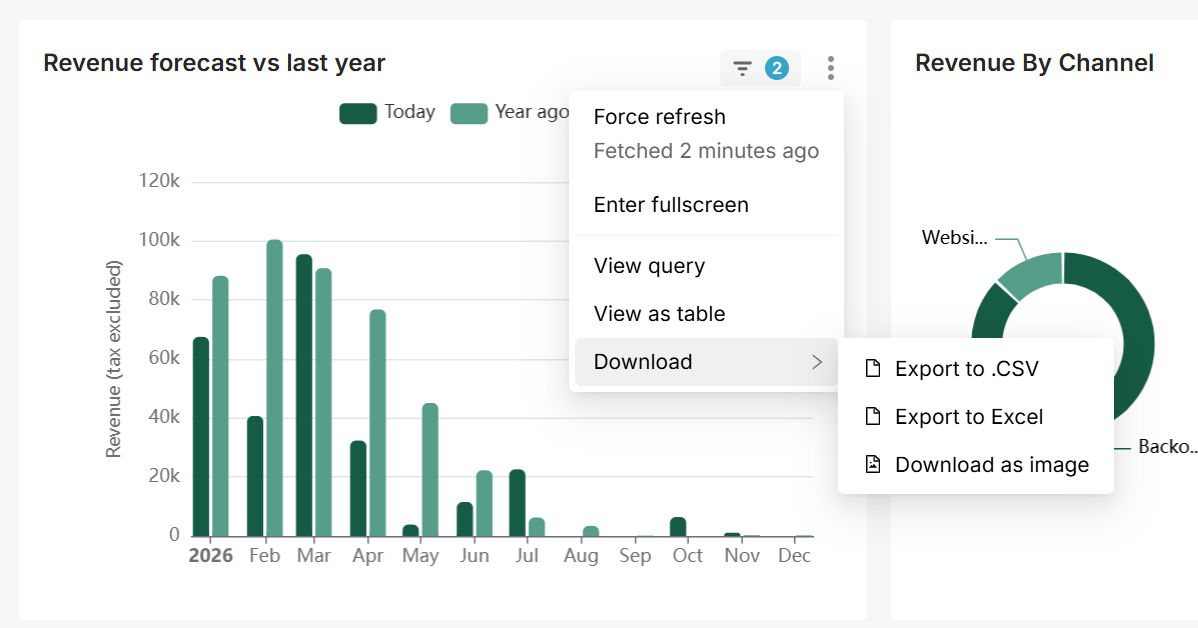
In graphs you can select:
single product (detailed analysis)
multiple products (broader comparison)
This enables both a quick overview and a deeper analysis.
Summary
Modern analytics helps you:
understand the current state of the business
track the development of sales
identify the most important products, customers and channels
make better commercial decisions
You get the most benefit when you use the dashboard regularly and combine the insights from the views with practical actions.