14.4.2026: New in Moder – Sales Analytics Dashboard
Last updated: April 15, 2026
We’ve now launched the first Analytics section in Moder – Sales Analytics. This new view presents your sales data in a clear, visual format, making it easier to track performance and understand your business in more detail. The Analytics section is available with Admin user access.
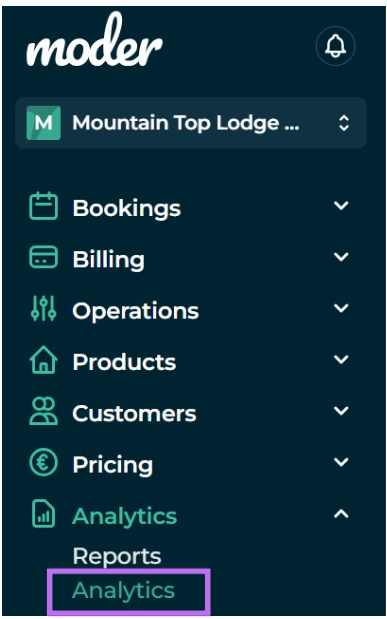
At the same time, the left-hand menu has been slightly updated: the familiar Reports section can now be found under the Analytics section. Nothing has changed in the Reports themselves – only the menu navigation has been updated.
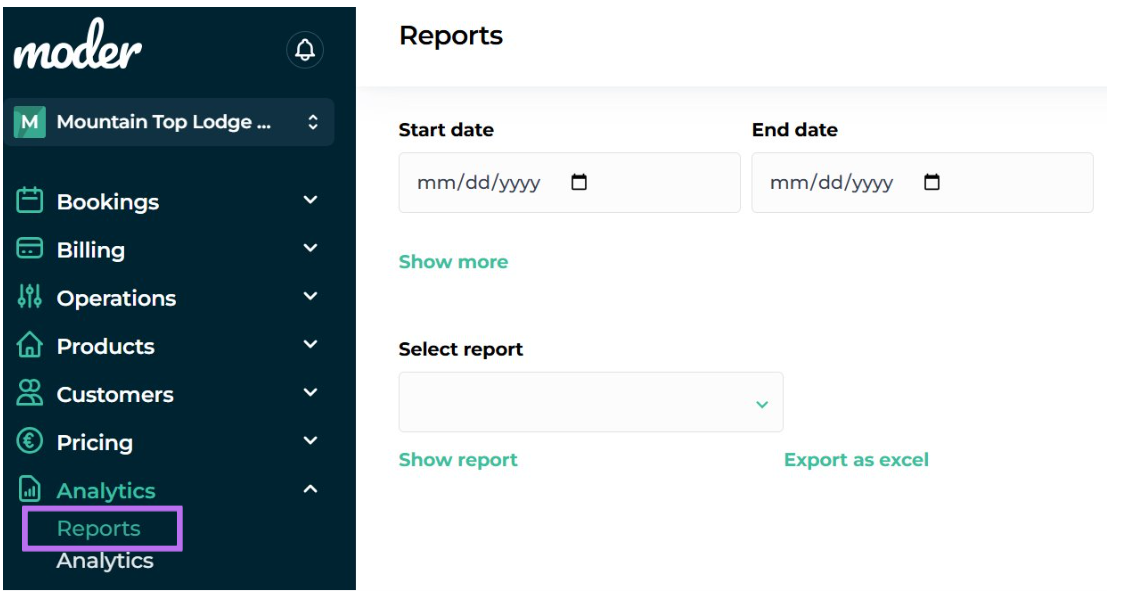
Sales Analytics Dashboard
The new Sales Analytics Dashboard helps you make better, data-driven decisions – quickly and clearly. You can see at a glance how your sales are developing and compare results directly to the previous year. All data can also be exported to Excel for further analysis.
What’s included in Sales Analytics?
Revenue forecast vs last year – compare this year’s revenue to last year
Revenue by Channel – revenue distribution by channel
Revenue forecast by category
Revenue forecast by product
Top Products – top 10 best-selling products within the selected time range
Top B2B Customers – top 10 largest B2B customers
Top Packages – top 10 best-selling packages (available only if you have packages created via Experience Designer packaging tool)
Sales VAT Breakdown
Sales by category and product
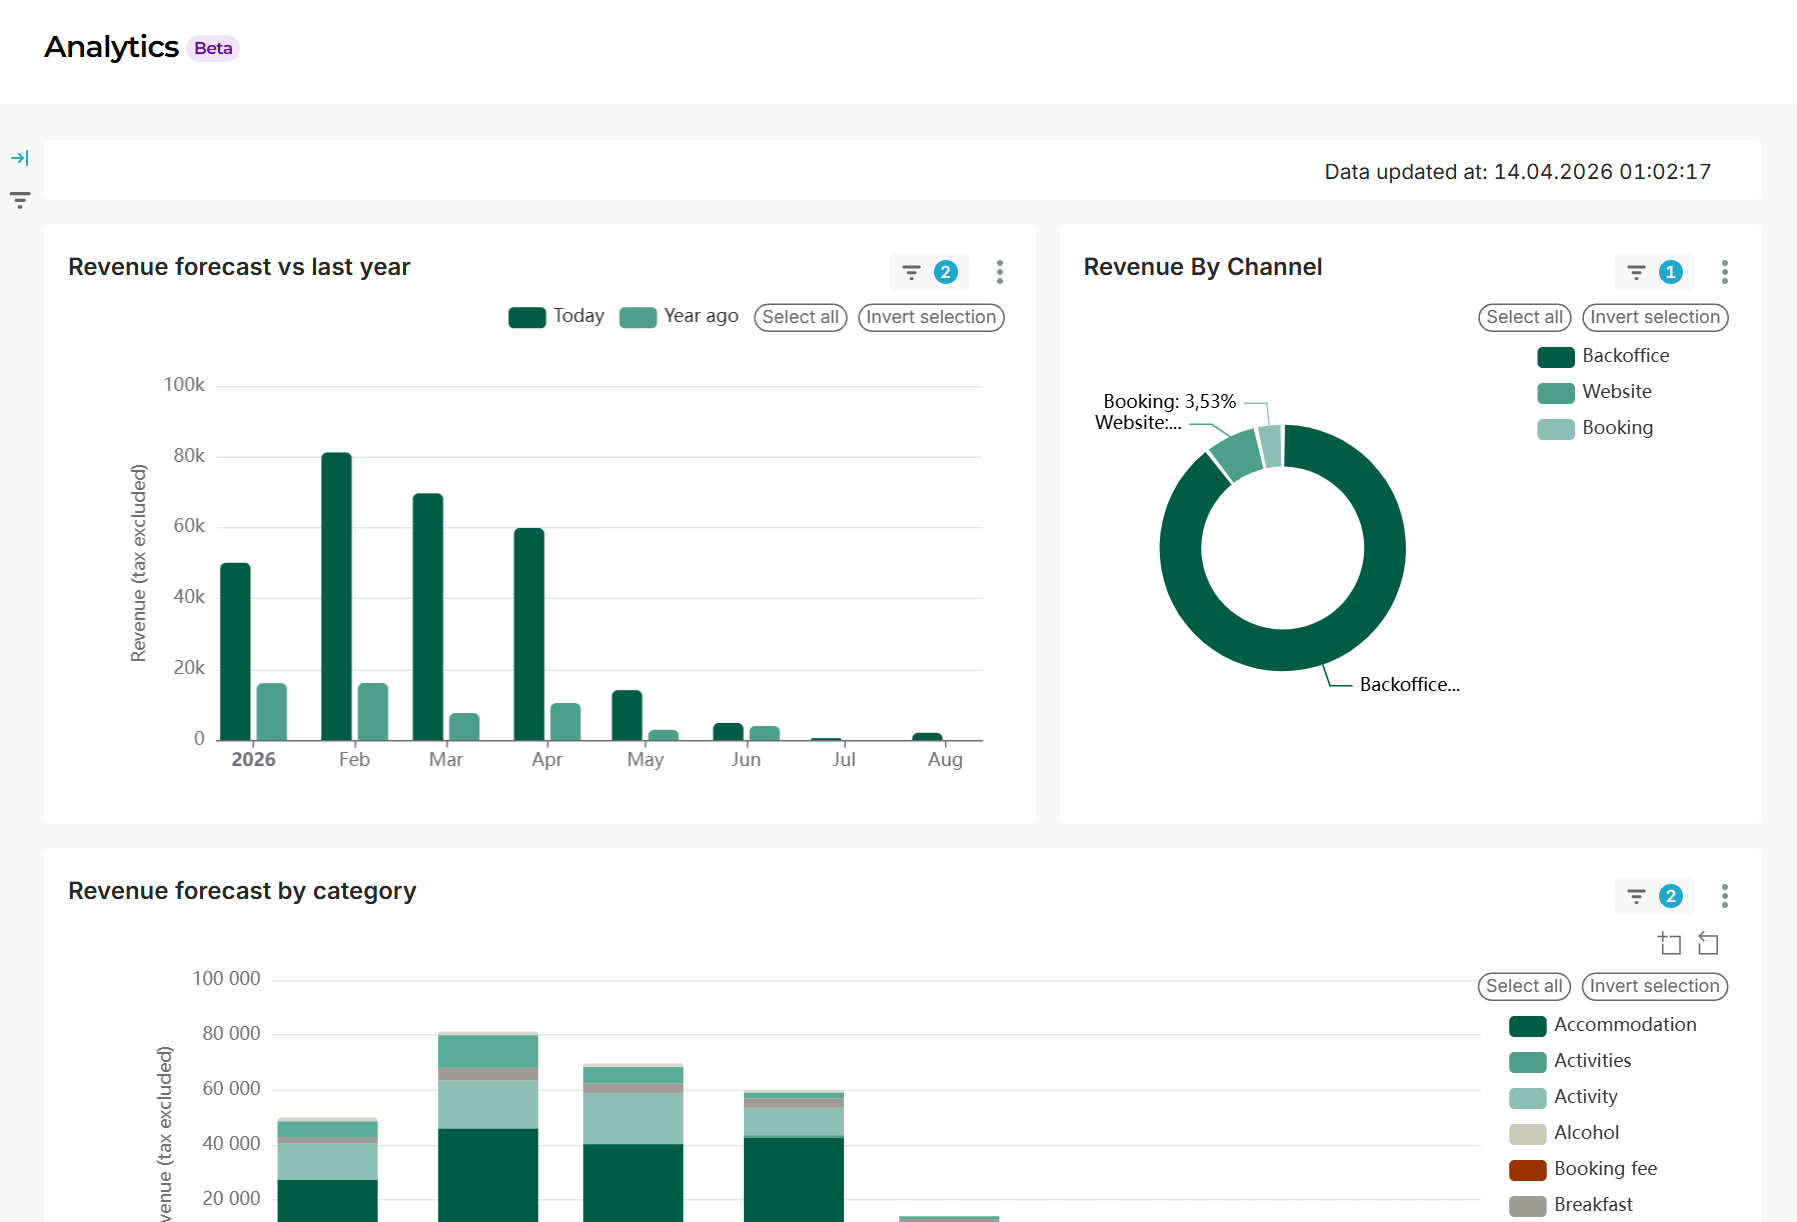
Powerful filtering options
You can easily narrow the view with the left-hand side filters. Filter data, for example:
by time interval
by category (e.g., accommodation, activities)
by product
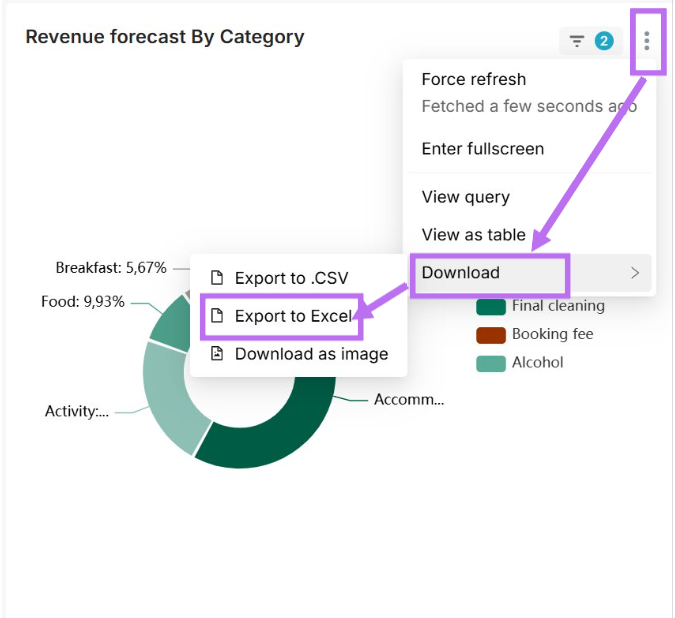
Export data to Excel with one click
Do you need the numbers for more detailed handling? Click the three dots at the top right of the table → Download → Export to Excel.
Detailed manual in this guide.